Ecommerce reporting without the spreadsheet maze

Every number you need. One clear view.

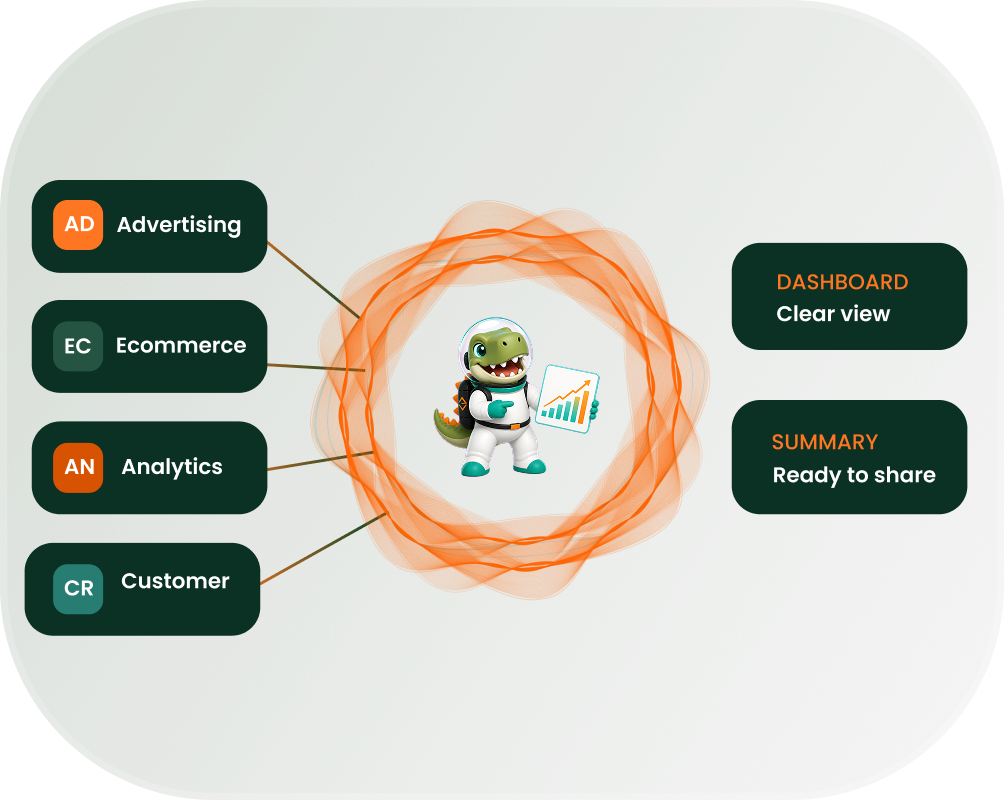
Connect ecommerce, advertising, analytics and conversion data to understand performance without
rebuilding the same report every week.

Built for ambitious brands across every channel
Shopify TikTok Google Meta LinkedIn HubSpot

Dashboard Configuration

Choose the reporting scope that fits your team.

Focused reporting

Standard

For teams that need a clear, dependable view of their most important performance measures.

Connected performance

Agency/ Reseller

For growing teams that need cross-channel reporting, clearer summaries and multiple decision views.

Need a different configuration?

We can scope reporting around your existing platforms, access requirements and stakeholder needs.

Reporting features

See what is happening - and what to do next.

Each feature connects ecommerce activity to the commercial question behind it, so teams can move from fragmented numbers to faster decisions.

Automated Reporting

MON

08

Revenue report

08:00

Channel summary

09:30

Margin alert

Live

Replace recurring spreadsheet work with structured reports that refresh on an agreed schedule.

  • Scheduled refreshes: Keep daily, weekly or monthly views current based on the available connection method.
  • Email summaries: Deliver concise updates to the people who need them.
  • Date comparisons: Compare current performance with previous periods or targets.

Performance Dashboards

Net revenue

R0k

↑ 12.4%

Bring revenue, leads, spend, conversion and other agreed KPIs into focused dashboards for faster review.

  • Commercial views: Track the measures closest to business outcomes.
  • Targets and pacing: See progress against agreed goals and reporting periods
  • Role-specific access: Give teams, leaders and clients views suited to their decisions.

AI Reporting Insights

Repeat customer value is trending upward.

Surface meaningful changes and useful questions in plain language without hiding the underlying data.

  • Trend summaries: Explain the direction and size of important movements.
  • Anomaly prompts: Flag unusual changes that may require investigation.
  • Transparent context: Keep source metrics and reporting periods visible.

Cross-Channel Reporting

ALL G M @ S

Compare paid media, organic search, ecommerce, email, website and conversion performance on a consistent basis.

  • Unified comparisons: Review channel contribution in one commercial view.
  • Consistent definitions: Reduce confusion caused by mismatched names and calculations.
  • Shared date ranges: Compare like with like across reporting periods.

Client & Team Reporting

Monthly Team view
Performance report
Ready to share

Create clear, presentation-ready reporting experiences for internal stakeholders and agency clients.

  • Ready-to-share views: Reduce time spent formatting monthly presentations.
  • Selected results: Show each audience the metrics relevant to its role.
  • Reporting notes: Add definitions and context where interpretation matters.

Dashboard Configuration

Start with the decision the dashboard must support

Explore four example dashboard configurations built from the modules above.

Start with the decision the dashboard must support

Core measures

Spend · leads · qualified leads · cost per lead

Quality signals

Source · status · stage · lead-to-sale progression

Useful filters

Channel · campaign · audience · form · period

Connect acquisition activity to commercial outcomes.

Core measures

Revenue · margin · orders · acquisition cost

Customer signals

New customers · repeat revenue · order value

Useful filters

Channel · campaign · product · category · period

Reporting output

Commercial performance and pacing summary

See how organic visibility contributes to demand.

Core measures

Visibility · clicks · organic sessions · enquiries
 

Contribution signals

Landing-page conversion · assisted conversions

Useful filters

Query · page · device · location · period

Reporting output

Search visibility and conversion summary

Understand what visitors do after they arrive.

Core measures

Sessions · engaged visits · form completion · conversion rate

Journey signals

Landing pages · paths · exits · revenue per visit

Useful filters

Source · page · device · audience · period

Reporting output

Website journey and conversion summary

Implementation architecture

How source data becomes a governed dashboard

Source Mapping

Document accounts, data ownership, refresh frequency, identifiers and known source limitations.

Metric Governance

Define revenue, customer, acquisition and margin calculations so every team reads the same number.

Dashboard Assembly

Combine approved modules, filters, targets and permissions into role-specific workspaces.

Quality review

Validate calculations, refresh behaviour and stakeholder access before launch.


REPORTING OUTPUTS

Configure reporting around the way your team works

Filters

Custom date ranges, channels, campaigns, products and audiences.

Exports

CSV and presentation-ready outputs where supported.

Summaries

Scheduled reporting updates for recurring review.

Views

 Role-based dashboards for teams, clients and leadership.

Targets

Pacing indicators and agreed performance thresholds.

Governance

Metric definitions, notes and known source limitations.