
Bring ecommerce, advertising, analytics, search and customer data into one clearer reporting environment
– without building another spreadsheet every month.
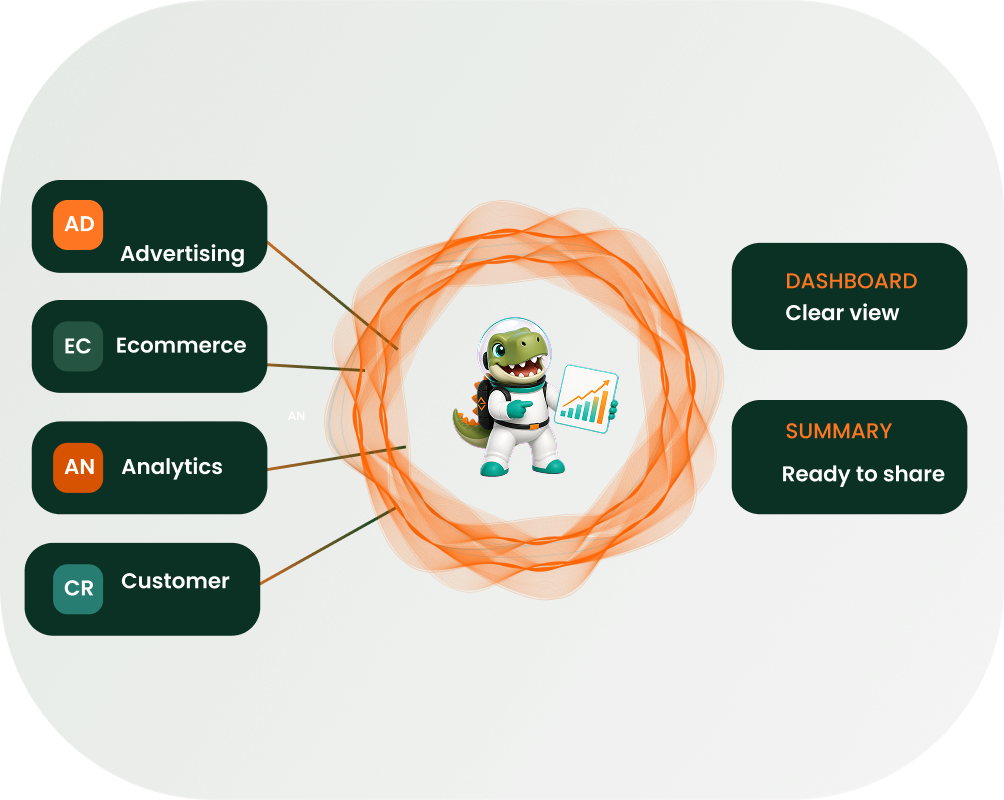
Every reporting setup is scoped around your accounts, required metrics, permissions and the connection
methods available for each source.
Bring orders, revenue, product and customer performance into a broader marketing view.
Connect traffic, behaviour and conversion events to marketing performance.
Monitor organic visibility, queries, clicks and landing-page performance.
Support a governed measurement setup for agreed website and conversion events.
Connect marketing activity to lifecycle, lead and pipeline signals where access and
data structure allow.
We start with the decisions your report needs to support, then work backwards to the appropriate sources
and fields.
Identify approved accounts, owners, required fields and access constraints.
Confirm the most appropriate connection route for each approved source.
Align names, dates, attribution context and metric definitions.
Surface refresh status and maintain a clearer reporting rhythm for your team.
Surface refresh status and maintain a clearer reporting rhythm for your team.
The goal is not to collect every available field. It is to create a reporting model that helps your team understand what happened, why it matters and where to focus next.
How are paid, organic, email and direct channels performing together?
Which activity is connected to leads, purchases and revenue?
How are acquisition cost, conversion rate and return changing?
Which products, audiences or journeys contribute to repeat value?
Are stakeholders working from the same definitions and periods?
MarketRush AI brings marketing, website and conversion data into clear dashboards and reports. It helps
teams compare performance, identify meaningful changes and communicate results without rebuilding
spreadsheets every month.
MarketRush AI can support reporting across ecommerce, advertising, analytics, search and CRM
platforms. Available connections depend on account access, data availability and the reporting
requirements agreed during setup.
Yes. Recurring dashboards, scheduled summaries and standardised metrics can replace much of the
manual copying, screenshotting and spreadsheet work involved in regular reporting.
Yes. Agencies can use structured, client-ready reporting views to improve consistency, transparency and
the speed of monthly reporting.
Yes. Dashboards can be configured around the channels, KPIs, date ranges and business outcomes that
matter to each team or client.
MarketRush AI can surface plain-language summaries, notable changes and useful questions while
keeping the underlying source data visible for review.
Measurement is based on agreed definitions for metrics such as spend, revenue, leads, conversion rate,
acquisition cost and return. This gives teams a consistent basis for comparison.
We review your reporting goals, current platforms and existing process, then show how MarketRush AI
could organise your data into a clearer reporting workflow.